
Are infographics still in style?
The question of whether infographics are still a thing comes up a lot in conversations about effective communications tactics. We want answers and insight, so we recently surveyed over 900 communications pros to capture their thoughts. You may be surprised with what we found!
Trends in every industry come and go, but when it comes to communications planning, whether the target audience is internal or external, staying in vogue is important if you want to capture and hold people’s attention. And let’s face it, our attention span is shorter than ever before, thanks in part to the proliferation of short form content on social media. Compounding the problem is the amount of content we are bombarded with as we move through our day, from work life to home life and everything in between. Also, there is never enough time to do everything that needs to get done. It weighs heavily on all of us, so it really is no wonder that some studies say the average human now has an attention span of eight seconds!
So, what is one way to capture and hold your audience’s attention? An infographic, when done right, may be the solution.
Oxford dictionary: An infographic is, “information or data that is shown in a chart, diagram, etc. so that it is easy to understand.”
Survey Says…
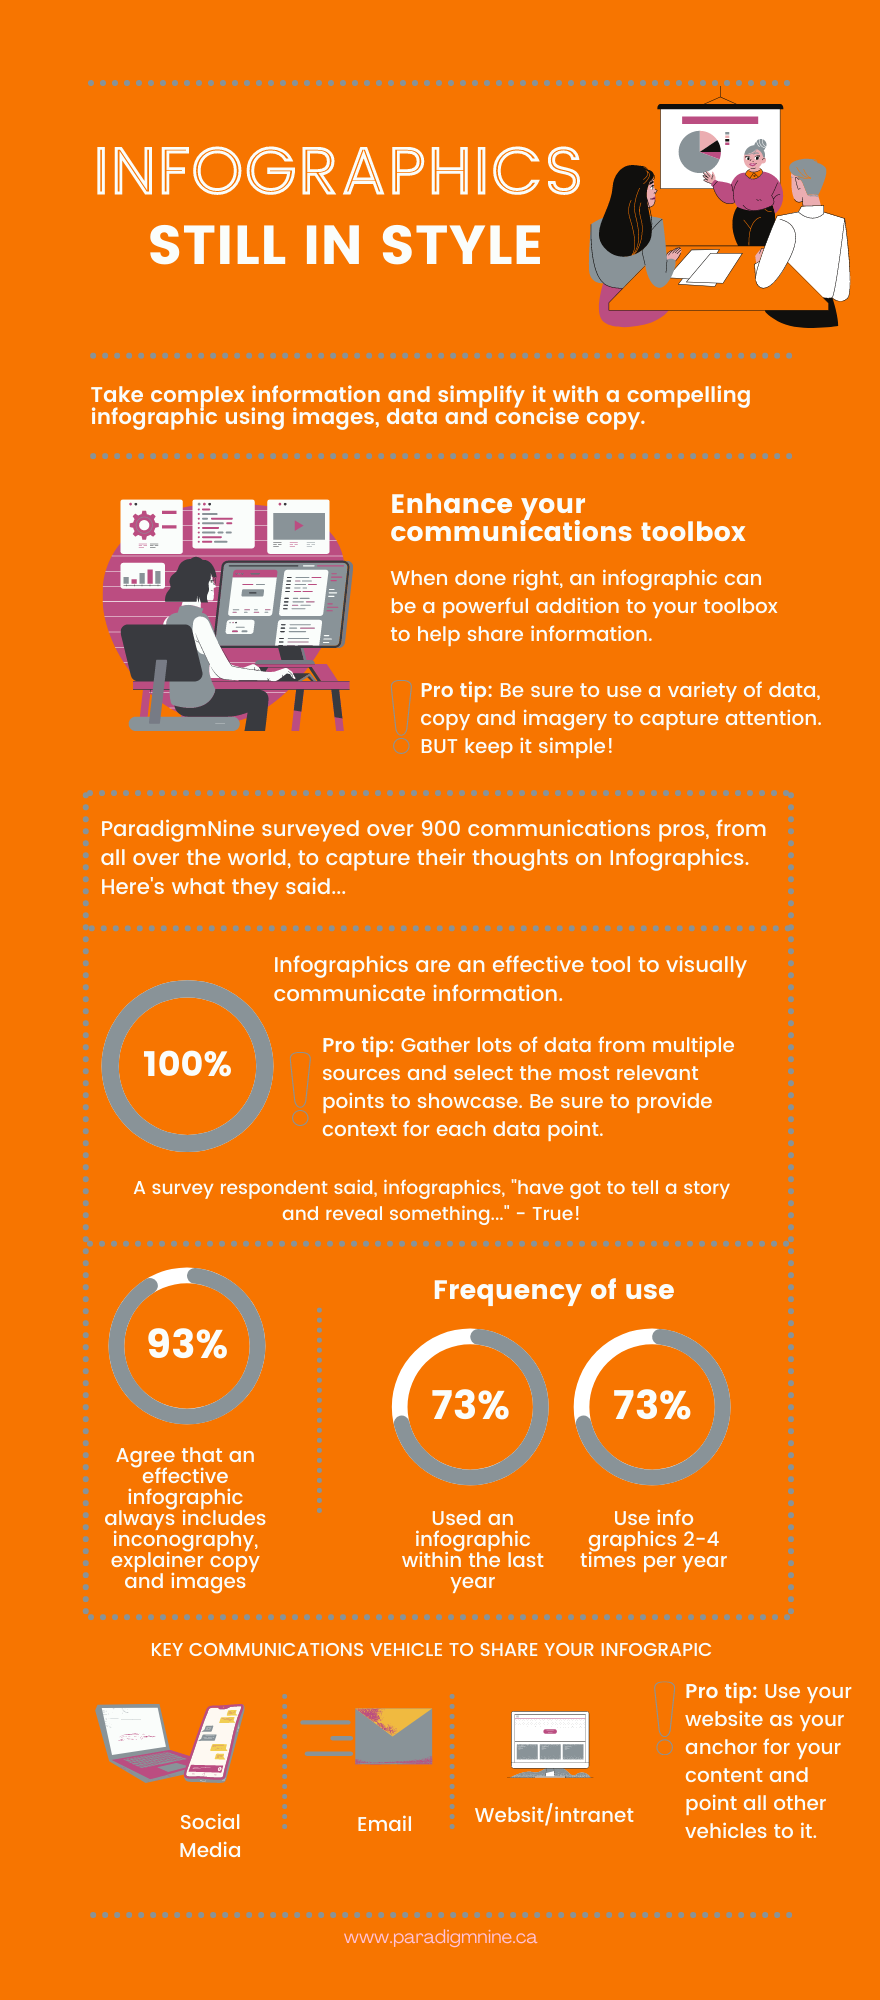
100% of our survey respondents agree that infographics are an effective tool to visually communicate information. While our survey revealed that most respondents (73%) use infographics at least one per year, we have found that it may not always be effective in every circumstance. In our experience, infographics are most useful when you need to simplify complex information involving a lot of data. Check out our infographic for more on our survey results (see what we did there ;))!
A Practical Example
One of our clients, the management team of a municipally owned high-performance sports complex, needed a way to capture an entire year’s worth of successes to showcase to their city council. The challenge was they only had 10 minutes on a packed council meeting agenda to do it! Knowing that the audience would be distracted, we came up with the idea of using an infographic to highlight key metrics such as the number of events hosted, overall economic impact, and key areas of focus for the coming year etc. We then created unique iconography and included concise explainer paragraphs for each metric. The result? A one-page (two sides) infographic highlighting all that the facility had accomplished in one year, providing a quick glance. Mission accomplished.
So, if you find yourself in a similar situation, here are four steps to help you get started:
- Plan – What, where, when, and how. Create a comprehensive plan to determine what your infographic will show and how you will communicate it. Start by answering these questions: “What are the key points we need to highlight?”, “Which data will make the most impact?”, “Who do we want to share it with and why?” Next, figure out a theme and choose imagery or iconography that have a consistent look, colour pallet and style to tie it all together. Be sure to stay within your brand guidelines.
- Research – Investing upfront time to find relevant data will pay off in the long run and give your infographic more credibility. There are resources aplenty in every corner of the internet, in industry publications, and very likely within your organization. If you cannot find relevant data, consider conducting your own survey or poll to gather the data you need. Here is a link with a Survey 101 from Survey Monkey: https://www.surveymonkey.com/mp/survey-guidelines.
- Design – It is easy to find online resources with templates to “plug and play” your content. You can also purchase a template from sites like Fiverr, which has various price point options. But if you are really stumped and have the budget, consider hiring a graphic designer to help you. Whichever way you decide to go, an effective infographic should include these elements:
- An attention-grabbing title to draw your reader in
- A brief opening paragraph to set expectations
- Concise explanations of each data point
- Interesting imagery, including iconography and graphic elements
- Publish – as a guiding principle, your website (if you have one), should be the anchor to house all your content. But don’t stop there. Use all your channels (email, social media, intranet etc.) to broaden your reach and then point back to your website. This approach will not only amplify your infographic, but will also drive traffic to your website. And we could all use more traffic to our websites, right? Finally, if applicable, share your infographic with select leaders within your organization to use in relevant presentations.
If you need help getting started with your communications strategy or maybe you want to refine the one you already have, get in touch. ParadigmNine will help you unlock the power of communications with meaningful, high-value strategies to engage the people who matter the most to you.
Recent Comments